Annotations
Given an XML file of annotations, extract the data into the appropriate DICOM element.
If you have Annotations in the XML file structure listed below, and you want to include them in your DICOM file, then all you need to do is to add the Annotations key and the associated file path to the General attribute in the YAML file.
- General:
- Annotations: ‘/path/to/xmlFile’
Getting some sample XML data
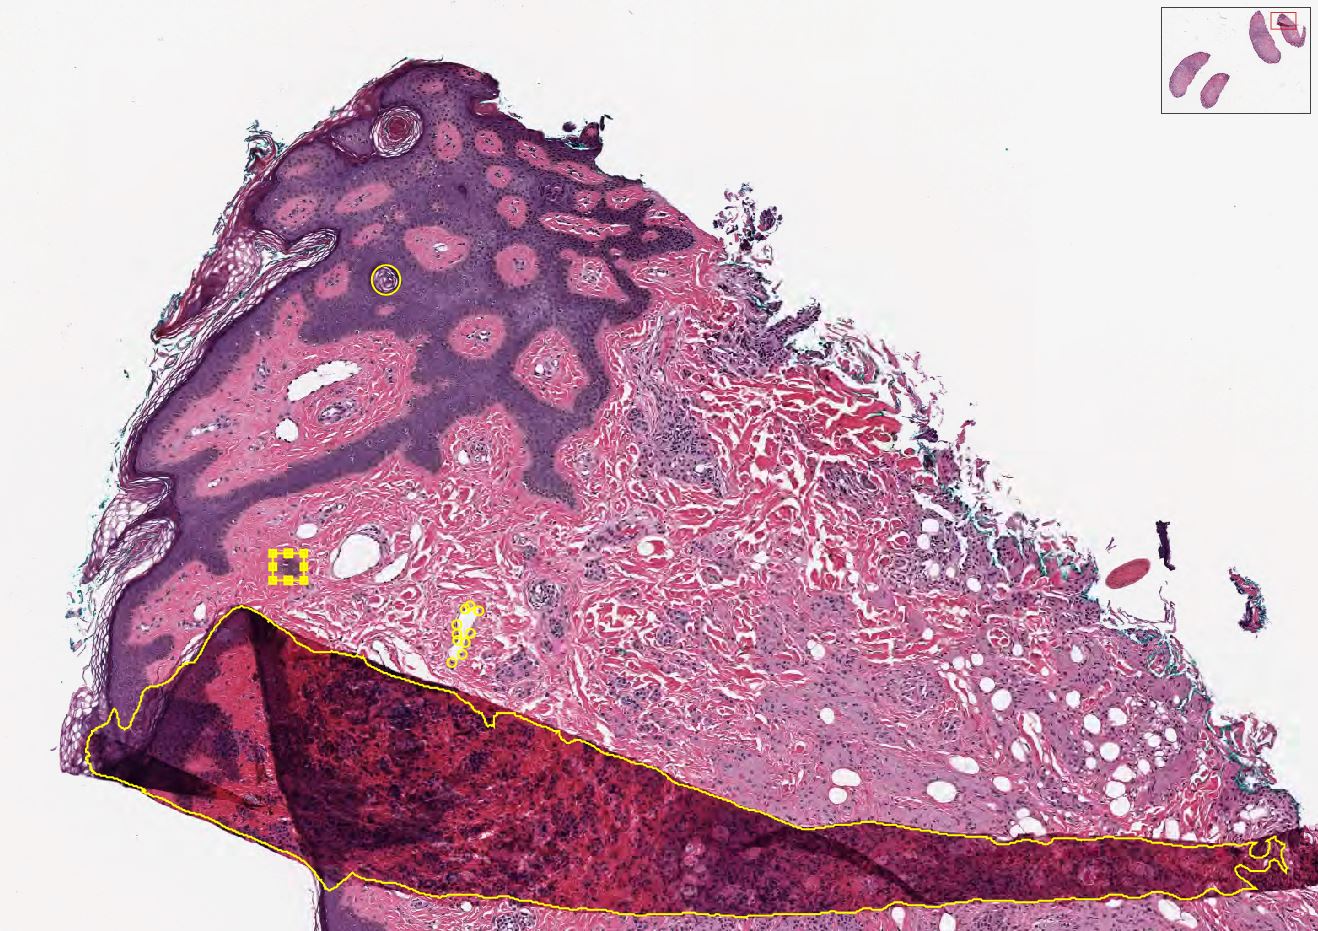
We have prepared some different annotations on the Aperio example CMU-1-JP2K-33005.svs. These examples were drawn using QuPath and extracted with this script. The annotations have no physiological relevance, only to show how the different data types can be stored inside DICOM. Each of the yellow markups in the image above describe one of the following data types:
- Points
- Rectangle
- Area
- Ellipse
All of the data types should be encoded in an XML tree that looks like the following:
<Annotations>
  <Annotation>
    <Regions>
      <Region Text="null" GeoShape="Points">
        ...
      </Region>
    </Regions>
  </Annotation>
</Annotations>
The important characteristics here are Text=”null” and GeoShape=”Points”. These define a human readable label(Text), and a data type (GeoShape). Each will be discussed below.
Points
The simplest annotation type is the point. It defines as specific x and y coordinate (pixel). Each entry in this group represents an independent data point. If there are points that have different meanings (e.g. mitosis vs lymphocyte), then they should be grouped in a different section with a different Text value.
<Region Id="1" Type="0" Text="null" GeoShape="Points" Zoom="0.042148" Selected="0" ImageLocation="" ImageFocus="0" Length="74565.8" Area="213363186.2" LengthMicrons="18798.0" AreaMicrons="13560170.4" NegativeROA="0" InputRegionId="0" Analyze="1" DisplayId="1">
  <Attributes/>
  <Vertices>
    <Vertex X="37279.312500" Y="4662.189453"/>
    <Vertex X="37319.550781" Y="4588.894043"/>
    <Vertex X="..." Y="..."/>
   </Vertices>
</Region>
Rectangle
The next simplest annotation is a rectangle, or bounding box. These annotations define an area that contains an object of interest. They require four different points to describe the boundaries of the x and y corners.
<Region Id="2" Type="2" Text="Necrosis" GeoShape="Rectangle" Zoom="0.042148" Selected="0" ImageLocation="" ImageFocus="0" Length="74565.8" Area="213363186.2" LengthMicrons="18798.0" AreaMicrons="13560170.4" NegativeROA="0" InputRegionId="0" Analyze="1" DisplayId="1">
  <Attributes/>
  <Vertices>
    <Vertex X="36406.388563" Y="4324.243648"/>
    <Vertex X="36554.076020" Y="4324.243648"/>
    <Vertex X="36554.076020" Y="4452.625555"/>
    <Vertex X="36406.388563" Y="4452.625555"/>
  </Vertices>
</Region>
Area
An area annotations structured identically to the bounding box, except that there can be any number of x,y coordinate pairs. This is the annotation typically used for image segmentation.
<Region Id="3" Type="1" Text="Fold" GeoShape="Area" Zoom="0.042148" Selected="0" ImageLocation="" ImageFocus="0" Length="74565.8" Area="213363186.2" LengthMicrons="18798.0" AreaMicrons="13560170.4" NegativeROA="0" InputRegionId="0" Analyze="1" DisplayId="1">
  <Attributes/>
  <Vertices>
    <Vertex X="36382.175781" Y="4644.585938"/>
    <Vertex X="36389.238281" Y="4651.647949"/>
    ...
    <Vertex X="36262.121094" Y="4573.966309"/>
    <Vertex X="36255.058594" Y="4573.966309"/>
  </Vertices>
</Region>
Ellipse
Ellipses are just circular annotations. They have the same structure as Rectangles, but rather than being connected by straight lines in an image viewer, they will instead be connected with curved lines.
<Region Id="4" Type="0" Text="null" GeoShape="Ellipse" Zoom="0.042148" Selected="0" ImageLocation="" ImageFocus="0" Length="74565.8" Area="213363186.2" LengthMicrons="18798.0" AreaMicrons="13560170.4" NegativeROA="0" InputRegionId="0" Analyze="1" DisplayId="1">
  <Attributes/>
  <Vertices>
    <Vertex X="36943.806573" Y="2957.558623"/>
    <Vertex X="37011.368077" Y="3027.752393"/>
    <Vertex X="36943.806573" Y="3097.946164"/>
    <Vertex X="36876.245069" Y="3027.752393"/>
  </Vertices>
</Region>
Inserting into the DICOM file
This process assumes you have a pydicom object called ds. Let’s go ahead and build out the base for our annotations.
from pydicom.sequence import Sequence
from pydicom.dataset import Dataset

ds = ... # Stuff to create DICOM file
dsDisplayedArea = Dataset()
dsDisplayedArea.PresentationSizeMode = 'TRUE SIZE'
ds.DisplayedAreaSelectionSequence = Sequence([dsDisplayedArea])
ds.GraphicAnnotationSequence = Sequence([])
ds.GraphicAnnotationSequence[0].ReferencedImageSequence = Sequence([])
ds.GraphicAnnotationSequence[0].ReferencedImageSequence[0].GraphicObjectSequence = Sequence([])
Determine what type of annotation element is needed:
- Rectangle
# Graphics on the first referenced image
GraphicObjectSequence  = Dataset()
GraphicObjectSequence.BoundingBoxTopLeftHandCorner = [36406.388563, 4452.625555]
GraphicObjectSequence.BoundingBoxBottomRightHandCorner = [36554.076020, 4324.243648]  # bottom right coordinates of bounding box [max_x, min_y]
GraphicObjectSequence.BoundingBoxAnnotationUnits = 'PIXEL'  # unit of coordinates
GraphicObjectSequence.BoundingBoxHorizontalJustification = 'LEFT'
GraphicObjectSequence.UnformattedTextValue = 'Necrosis'  # Text="Necrosis"
GraphicObjectSequence.GraphicGroupID = '2'  # Id="2"
gos = Sequence([GraphicObjectSequence])
ds.GraphicAnnotationSequence[0].ReferencedImageSequence[0].GraphicObjectSequence.append(gos)
del GraphicObjectSequence
del gos
- Points
GraphicObjectSequence  = Dataset()
GraphicObjectSequence.GraphicType = "POINT"
GraphicObjectSequence.NumberofGraphicPoints = 4  # how many points where saved in this domain, validate data is complete
GraphicObjectSequence.GraphicData = [37279.312500, 4662.189453, 37319.550781, 4588.894043, ..., ...]   # x,y coordinates of points [x0, y0, x1, y1 ....]
GraphicObjectSequence.GraphicAnnotationUnits = 'PIXEL'  # unit of coordinates
GraphicObjectSequence.GraphicGroupID = '1'  # Id="1" Type="0" Text="null"
gos = Sequence([GraphicObjectSequence ])
ds.GraphicAnnotationSequence[0].ReferencedImageSequence[0].GraphicObjectSequence.append(gos)
del GraphicObjectSequence
del gos
- Area
GraphicObjectSequence  = Dataset()
GraphicObjectSequence.GraphicType = "POLYLINE"  # add polyline
GraphicObjectSequence.NumberofGraphicPoints = 4 # how many points where saved in this domain
GraphicObjectSequence.GraphicData = [36382.175781, 4644.585938, 36389.238281, 4651.647949, ..., ...]
GraphicObjectSequence.GraphicAnnotationUnits = 'PIXEL'  # unit of coordinates
GraphicObjectSequence.GraphicGroupID = 3  # Annotation Label ID: 2
gos = Sequence([GraphicObjectSequence ])
ds.GraphicAnnotationSequence[0].ReferencedImageSequence[0].GraphicObjectSequence.append(gos)
del GraphicObjectSequence
del gos
- Ellipse
GraphicObjectSequence  = Dataset()
GraphicObjectSequence.GraphicType = "ELLIPSE"
GraphicObjectSequence.NumberofGraphicPoints = 4 # how many points where saved in this domain
GraphicObjectSequence.GraphicData = [36943.806573, 2957.558623, 37011.368077, 3027.752393, 36943.806573, 3097.946164, 36876.245069, 3027.752393]
GraphicObjectSequence.GraphicAnnotationUnits = 'PIXEL'  # unit of coordinates
GraphicObjectSequence.GraphicGroupID = 3  # Annotation Label ID: 2
gos = Sequence([GraphicObjectSequence ])
ds.GraphicAnnotationSequence[0].ReferencedImageSequence[0].GraphicObjectSequence.append(gos)
del GraphicObjectSequence
del gos